 pokalab.com
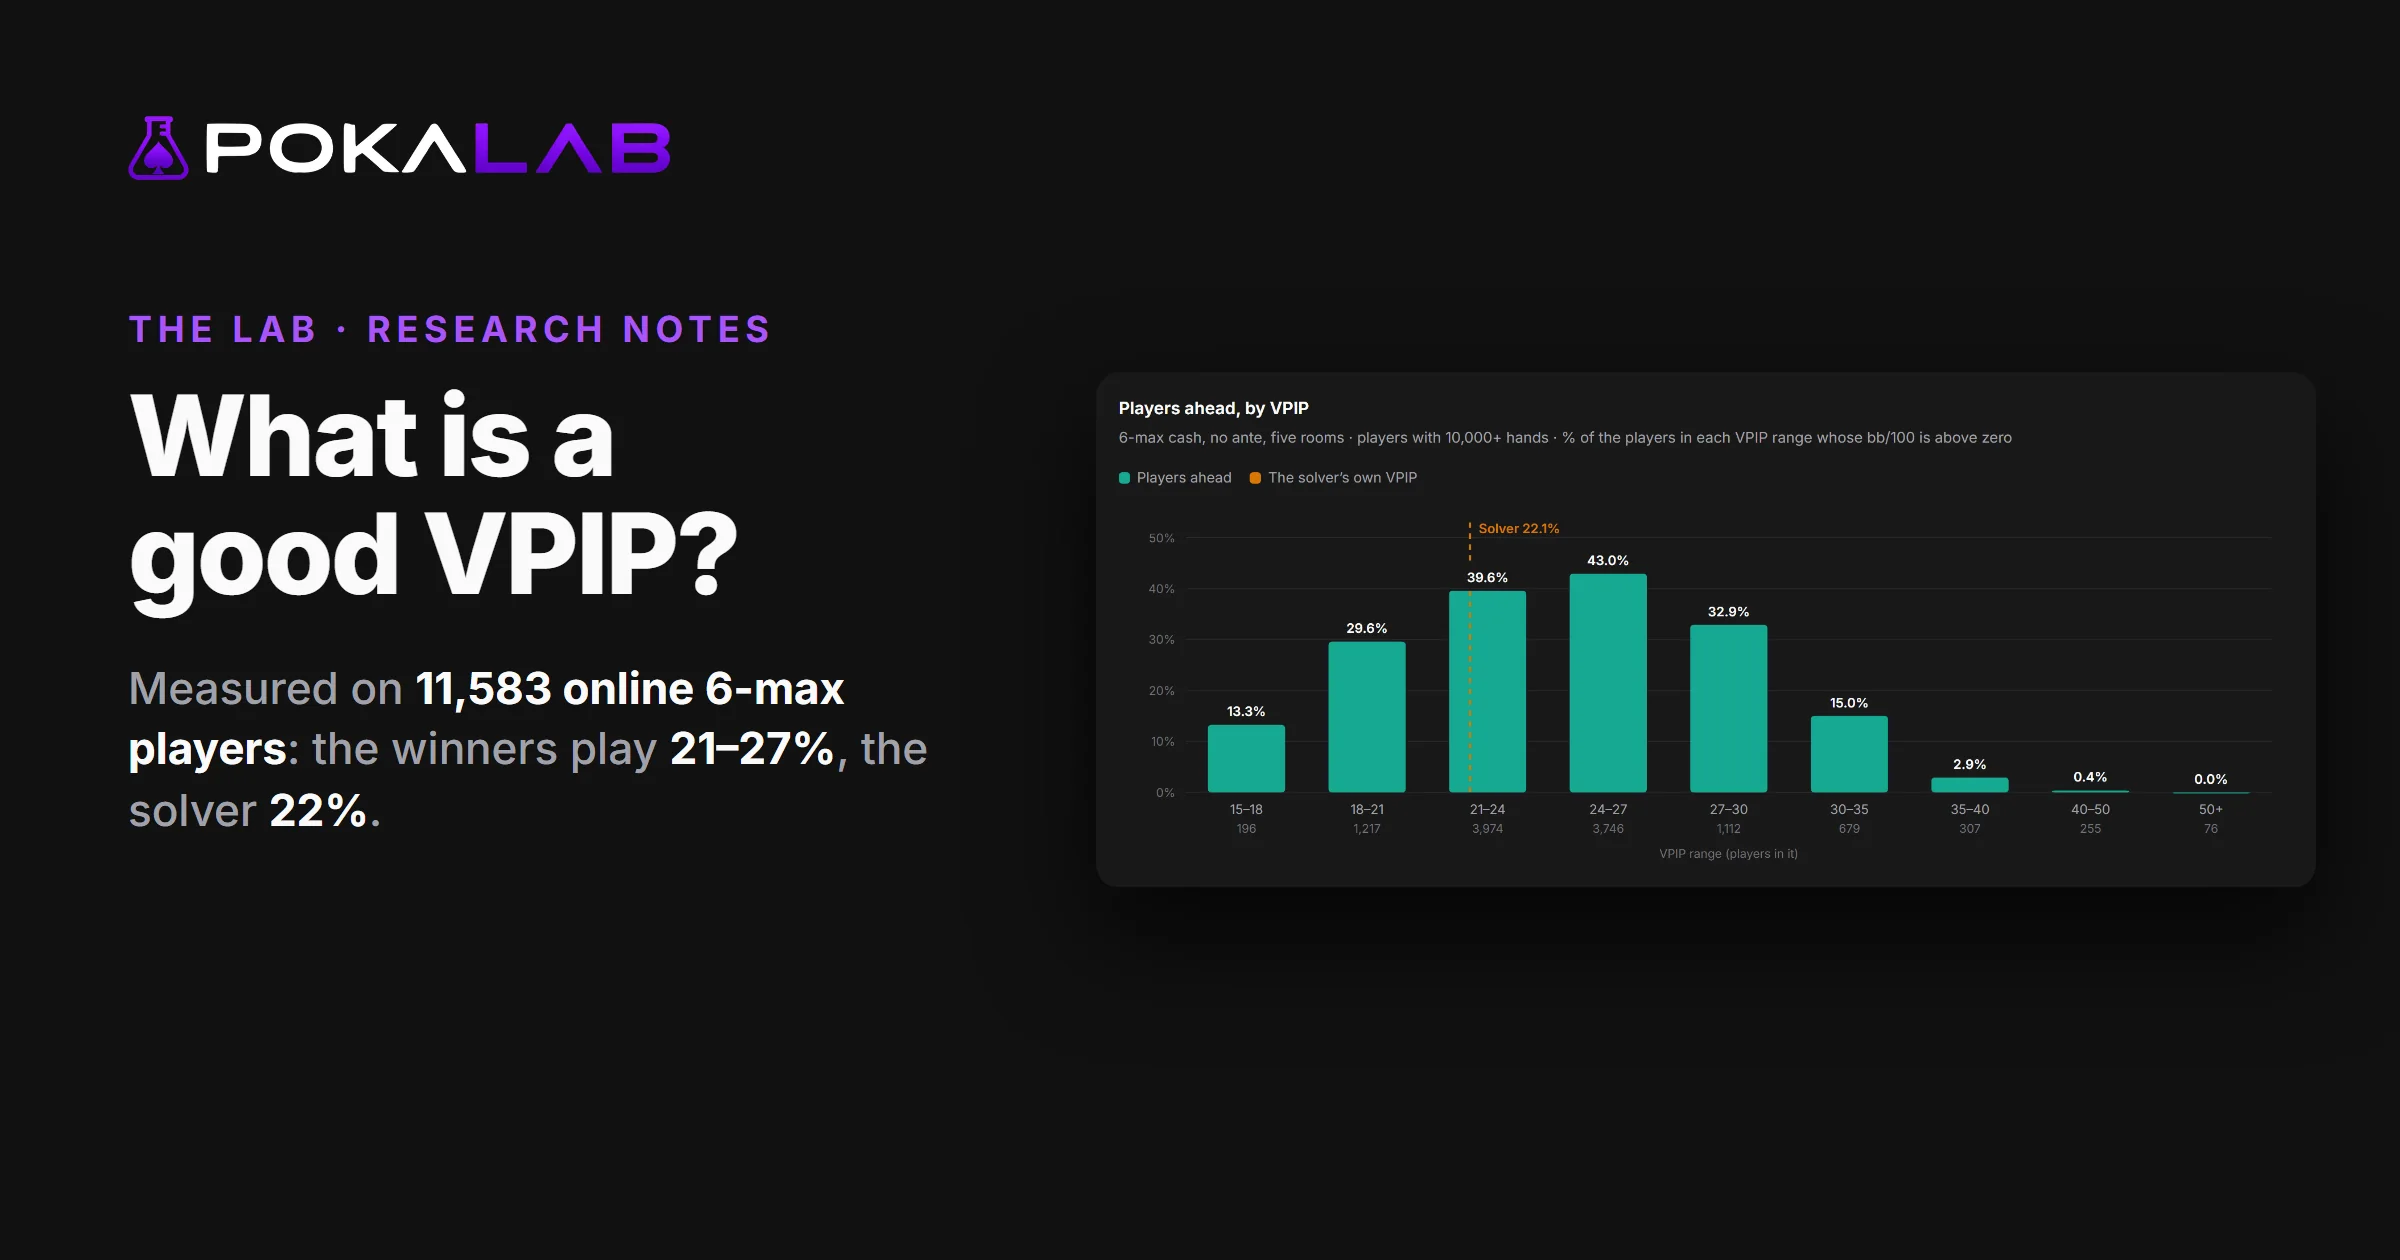
- Winners play 21 to 27. Of the 4,048 players who finished ahead over 10,000 hands or more, eight in ten have a VPIP between 21% and 27%. The median is 24%.
- The solver plays about 22%. With a 2.5x open at 100 big blinds, Pokalab’s 6-max solutions enter 21–23% of their hands and raise 18%.
- Above 30, the winners thin out fast. Between 21 and 27, about four players in ten are ahead. Between 30 and 35, 15%; between 35 and 40, 3%; above 40, one player out of 331.
- A good VPIP does not make a winner. The players who lose have almost the same median VPIP (24.3% against 24.0%). What sets them apart is the loose tail, and a wider gap between VPIP and PFR.
- Stakes move it a little, rooms hardly at all. The winners’ median goes from 22.4% at NL25 to 25.2% at NL1000, and sits between 23.7% and 24.6% in each of the five rooms.
What VPIP measures
VPIP, “voluntarily put money in pot”, is the share of the hands you were dealt in which you chose to put chips in before the flop: a call, a limp or a raise. Posting a blind does not count, and neither does checking your option in the big blind. It is one number for all six seats, and it says nothing about what you do after the flop.
One detail matters when you compare with your HUD: we count every hand dealt, including the walks the big blind wins when everyone folds. A tracker that leaves walks out reads about 0.6 points higher; on that convention, the winners’ median below would show 24.6% instead of 24.0%.
The question “what is a good VPIP?” is usually answered from experience. We answered it from real hands in Pokalab’s database of ~300M real hands: which VPIP do the players who win actually run, and how many players win at each VPIP?
- The games: real-money 6-max cash on five rooms (GGPoker, PokerStars, iPoker, WPN and 888poker): four to six players dealt, no ante, every stack depth. Hands from late 2021 to early 2026 on GGPoker, from 2024 on PokerStars, iPoker and 888poker, from 2025–26 on WPN.
- The players: one player is one screen name on one room. The main figures use the 11,583 players with at least 10,000 hands, enough for a VPIP to be known to within a point; the section on volume uses all 62,994 with at least 1,000.
- Winning: a player is ahead when their result is above zero big blinds per 100 hands (bb/100), after rake and GGPoker’s jackpot fee, before any rakeback.
- The solver: Pokalab’s preflop solutions for 6-max, 100 big blinds deep, with each room’s rake. Its VPIP is the share of hands a player enters when all six seats play the solution.
Where the winners are
Sort the 11,583 players by VPIP and count, in each range, how many finished ahead.
Players ahead, by VPIP
6-max cash, no ante, five rooms · players with 10,000+ hands · % of the players in each VPIP range whose bb/100 is above zero
| VPIP | Players | Ahead | bb/100, all their hands |
|---|---|---|---|
| under 15 | 21 | — | −5.63 |
| 15–18 | 196 | 13.3% | −4.77 |
| 18–21 | 1,217 | 29.6% | −1.98 |
| 21–24 | 3,974 | 39.6% | −0.58 |
| 24–27 | 3,746 | 43.0% | −0.24 |
| 27–30 | 1,112 | 32.9% | −2.96 |
| 30–35 | 679 | 15.0% | −10.65 |
| 35–40 | 307 | 2.9% | −25.60 |
| 40–50 | 255 | 0.4% | −34.12 |
| 50+ | 76 | 0.0% | −58.75 |
pokalab.comThe last column pools every hand of the players in the range. Between 21 and 27 the group as a whole is close to break-even after rake (−0.58 and −0.24 bb/100); at 30–35 it loses 10.65 bb/100, and above 40 more than 34.
The shape does not depend on one room. Leave PokerStars out (its All-in Cash Out hands are not yet scored correctly in our data) and the order of the ranges is the same: 33.9% ahead at 21–24, 36.9% at 24–27, 29.3% at 27–30, 25.8% at 18–21 and 13.6% at 30–35.
Winners and losers run almost the same median
Here is the twist: the players who lose barely play more hands, on the median. Over 10,000 hands, the median VPIP of the players ahead is 24.0%; of the players behind, 24.3%. The difference is in the spread.
Where the VPIPs sit
6-max cash, no ante, five rooms · thin line: 10th to 90th percentile · bar: the middle half · dot: the median
pokalab.comSo a VPIP in the right range is close to necessary and far from sufficient. Even between 21 and 27, more than half of the players are not ahead. Their VPIP is fine; the money goes somewhere else.
The solver plays 22%
What does game theory say? A solver does not have a VPIP of its own; it has a range for every seat and every action. Seat it six times at a table and count how often each seat puts money in, and you get one. With a 2.5x open at 100 big blinds, Pokalab’s 6-max solutions enter 21.1% to 22.6% of their hands, in every room and at every stake we have solved, and raise about 18%.
The solver’s VPIP and PFR
Pokalab’s preflop solutions · 6-max, 100 big blinds, no ante, each room’s rake · six seats playing the solution
| Solution | Open size | VPIP | PFR |
|---|---|---|---|
| GGPoker NL50 | 2.5x | 22.1% | 18.2% |
| GGPoker NL500 | 2.5x | 22.2% | 18.4% |
| PokerStars NL500 | 2.5x | 21.9% | 18.2% |
| PartyPoker NL100 | 2.5x | 21.1% | 18.2% |
| PartyPoker NL1000 | 2.5x | 22.6% | 18.0% |
| GGPoker NL500 | 2x | 24.2% | 18.3% |
| GGPoker NL500 | 3x | 20.9% | 18.1% |
pokalab.comThe winners’ median sits about two points above the solver (24.0% against 22.1%), and their PFR a point above (19.4% against 18.2%). Most of that is table size, not style. The solver’s tables are six-handed, while about a third of the players’ hands were dealt at tables of four or five, where every seat plays more hands. Our independent check measured the same winners on their six-handed hands alone: their median VPIP comes close to the solver’s. So a VPIP of 22 to 24 is where both the solver and the winners are.
Stakes: a little looser as you move up
The winners’ VPIP, stake by stake
Five rooms (NL25: GGPoker only in our data) · players with 10,000+ hands at that stake, counted at that stake only · right: % of the players in each VPIP range who are ahead
| Stake | Players | Ahead | Winners’ median | Middle half | 21–24 | 24–27 | 27–30 | 30–35 |
|---|---|---|---|---|---|---|---|---|
| NL25 | 1,053 | 318 | 22.4% | 20.7–24.3% | 34.9% | 34.0% | 28.8% | — |
| NL50 | 3,978 | 1,671 | 23.3% | 21.8–25.1% | 46.2% | 48.7% | 38.1% | 27.3% |
| NL100 | 2,977 | 1,213 | 23.8% | 22.3–25.4% | 42.6% | 46.4% | 42.1% | 26.4% |
| NL200 | 2,204 | 978 | 24.4% | 22.9–25.7% | 42.7% | 53.7% | 40.8% | 16.2% |
| NL500 | 1,970 | 746 | 24.8% | 23.5–26.1% | 38.3% | 42.6% | 38.8% | 17.4% |
| NL1000 | 410 | 204 | 25.2% | 24.0–26.3% | 49.5% | 52.9% | 51.6% | — |
pokalab.comEvery room, the same answer
The winners’ VPIP, room by room
6-max cash, no ante · players with 10,000+ hands on the room · the VPIP of those ahead
| Room | Players | Ahead | 10th pct | Median | 90th pct | Median PFR |
|---|---|---|---|---|---|---|
| GGPoker | 7,280 | 1,674 | 21.0% | 23.9% | 27.1% | 19.1% |
| PokerStars | 2,012 | 1,160 | 21.2% | 24.1% | 27.1% | 19.6% |
| iPoker | 1,071 | 550 | 21.3% | 24.6% | 27.9% | 19.9% |
| WPN | 664 | 291 | 20.6% | 23.8% | 27.3% | 19.4% |
| 888poker | 556 | 373 | 20.5% | 23.7% | 27.6% | 19.4% |
pokalab.comThe gap between VPIP and PFR
VPIP counts every hand you play, PFR only the ones you raise; the difference is the hands you call or limp. The gap draws the same picture as VPIP, with a sharper edge: past 7 points, the share of winners drops from 40% to 18%.
Players ahead, by VPIP − PFR
6-max cash, no ante, five rooms · players with 10,000+ hands · the gap in points
| VPIP − PFR | Players | Ahead | bb/100, all their hands |
|---|---|---|---|
| under 3 points | 325 | 39.7% | −0.43 |
| 3–5 points | 5,338 | 45.6% | +0.20 |
| 5–7 points | 3,110 | 39.9% | −0.80 |
| 7–10 points | 1,185 | 17.6% | −6.21 |
| 10–15 points | 850 | 3.8% | −16.59 |
| 15+ points | 775 | 0.6% | −29.07 |
pokalab.comWhy the average player looks so loose
Take every player with 1,000 hands or more and the median VPIP is 29.9%, not 24. The difference is volume: the players who have played the most are the tight ones.
VPIP and results, by hands played
6-max cash, no ante, five rooms · every player with 1,000+ hands
| Hands played | Players | Median VPIP | Ahead |
|---|---|---|---|
| 1,000–3,000 | 34,906 | 34.5% | 17.2% |
| 3,000–10,000 | 16,505 | 28.5% | 18.8% |
| 10,000–30,000 | 6,656 | 24.7% | 27.1% |
| 30,000–100,000 | 3,676 | 23.7% | 43.6% |
| 100,000+ | 1,251 | 23.4% | 51.1% |
pokalab.comSo what is a good VPIP?
- In 6-max cash, about 24%, and between 21% and 27%. That is where eight in ten winners are, and where the solver is too (22% with a 2.5x open). On full six-handed tables, the winners sit lower in that range.
- Above 30 is a leak, above 35 almost always a losing one. Only 15% of the players at 30–35 were ahead, 3% at 35–40, and one player in 331 above 40.
- Below 18 is not safe either. At 15–18, 13% of the players were ahead; at 18–21, 30%.
- Keep PFR 3 to 5 points under VPIP. That gap has the most winners; at 10 points or more, fewer than one player in twenty-five is ahead.
- Give it a sample. VPIP is counted on every hand, so it settles quickly: a true 24% reads within about ±8 points after 100 hands, ±2.6 after 1,000 and under ±1 after 10,000 (95%).
Every player in this article is in MDA › Players: set the room and the stake, put the minimum at 10,000 hands, and sort by VPIP to see who plays what.
What the guides say
The pages that rank for the question agree on the order of magnitude and disagree on the edges. None shows a sample.
- BlackRain79: “A good VPIP percentage in a 6 person poker game is around 21%”, based on “my PokerTracker database of millions and millions of hands”. In our data, 21 is the low edge of the winners: 30% of the players at 18–21 are ahead, against 43% at 24–27. The same page’s line that above 40 a player is “almost always a long term losing poker player” holds: one in 331 was ahead.
- CardPlayer gives “an ideal VPIP is typically 20-30%” for 6-max. The top of that range is already past the winners’: nine in ten of them play under 27.2%.
- PokerCoaching puts “a VPIP of around 22 to 28” as typical for a winning 6-max player, which is the closest to what we measured (21–27).
- Poker Copilot, on where PFR should sit: “Between 2% and 3% lower than VPIP”. The winners’ median gap is 4.6 points, and a gap of 3 to 5 has more winners (45.6%) than a gap under 3 (39.7%).
Questions
What is a good VPIP for 6-max?
Around 24%, and inside 21–27%. Eight in ten players who finished ahead over 10,000+ hands are in that range. Room by room, the winners’ median is 23.7% to 24.6%; stake by stake, from NL25 to NL1000, 22.4% to 25.2%.
What is a good VPIP and PFR?
The median winner plays 24/19: a VPIP of 24% and a PFR of 19.4%, a gap of 4.6 points. The solver, with a 2.5x open, plays about 22/18.
Is a VPIP of 30 too high?
Over a real sample, yes. Between 30 and 35, only 15% of the players with 10,000+ hands were ahead, against about 40% between 21 and 27; as a group they lost 10.65 bb/100.
What is the GTO VPIP for 6-max?
About 22% at 100 big blinds with a 2.5x open, with a PFR of about 18%. A 2x open raises it to about 24%, a 3x open lowers it to about 21%. It is the VPIP of a table where all six players follow the solution.
Does checking the big blind count as VPIP?
No. Only chips you chose to put in count: a call, a limp, a raise. Posting the blind and checking your option are not voluntary. Walks are the other detail: we count them as hands dealt, and a tracker that leaves them out reads about 0.6 points higher.
How many hands until VPIP means something?
Fewer than most stats, because every hand dealt counts. A true 24% reads within about ±8 points after 100 hands, about ±4.8 after 300 and about ±2.6 after 1,000 (95%).
What VPIP do losing players have?
Most of them have a normal one: the median loser over 10,000+ hands plays 24.3%. The loose ones almost never win: of the 331 players with 10,000+ hands above 40, one was ahead.
What this does not say
- VPIP is not the cause. Winners and losers have almost the same median VPIP; a player who wins does many other things right. A good VPIP is where winners are, not what makes them win.
- These are survivors. Players with 10,000 hands are the ones who kept playing. Players with fewer hands are only in the volume table.
- Results after rake, before rakeback. Rakeback is not counted: a player just under zero may be ahead once it is paid. Rooms differ in rake, in years and in how many players win, which is why the room table compares VPIPs, not winrates.
- One number for six seats. VPIP by seat (the button against the lojack) is a different question, not measured here.
- 6-max, no ante. Full ring, heads-up, ante games and tournaments are not covered. The players’ figures cover every stack depth; the solver’s are 100 big blinds deep.
- The solver plays against itself. Its VPIP is that of a table of six solvers, with no limps in its trees, not of a solver seated in a real pool. Its tables are six-handed; about a third of the players’ hands were dealt four- or five-handed, and on six-handed hands alone every VPIP in this article would read lower.