How many hands can you play without winning? More than you think. Pick your game: every number comes from the variance calculator, and in cash games we checked it on real graphs, up to 400,000 hands.
Pokalab ResearchNovember 2026~12 min readCash · MTT · Sit & Go · Spin & Go · PLO
pokalab.com
What theory tells us vs what we measured
Winning regulars
What theory tells us
What we measured
Still down after 50,000 hands176 regs
28%
29%
Longest stretch without a new high, over 200,000 hands40 regs
79k hands
84k hands
Worst downswing, over 200,000 hands40 regs
30 buy-ins
28 buy-ins
Winning regulars
What theory tells us
What we measured
Still down after 50,000 hands303 regs
16%
15%
Longest stretch without a new high, over 200,000 hands100 regs
52k hands
55k hands
Worst downswing, over 200,000 hands100 regs
27 buy-ins
27 buy-ins
pokalab.com
How many hands can you play without winning?
Pick any day. 1 time in 20, you are still down after:
73–84k
hands at 5 bb/100
114–131k
hands at 4 bb/100
202–233k
hands at 3 bb/100
455–524k
hands at 2 bb/100
Theory
Chance you're still down
With the SD measured on the room's winning regulars.
5 bb/1004 bb/1003 bb/1002 bb/100
5 bb/1004 bb/1003 bb/1002 bb/100
pokalab.com
Even at 5 bb/100, you lose money over 10,000 hands 27–28% of the time.
At 3 bb/100, you are still down 100,000 hands later 12–14% of the time.
How far down can you go?
Pick any day. 1 time in 20, you fall this far below it, even if you play forever:
21–24
buy-ins at 5 bb/100
26–29
buy-ins at 4 bb/100
34–39
buy-ins at 3 bb/100
51–58
buy-ins at 2 bb/100
That is your bankroll. With fewer buy-ins, your risk of going broke is above 5%.
Look at all-in EV, not money — it takes the coolers out of your graph.
Judge your decisions, not your results — your stats spot by spot say more than 10,000 hands of results.
What about a whole career?
Every day is a new chance to hit a bad stretch, so your worst one keeps growing, but slower and slower.
Flip a coin 10 times and your longest run of tails is about 3. Flip it 1,000 times and it is about 9. Same coin, more chances. Your career works the same way: the odds above are the same on any day, and each new day is one more chance to hit a long bad stretch.
Theory
Your longest stretch without a new high
A new high is the highest your graph has ever been.
5 bb/1004 bb/1003 bb/1002 bb/100
5 bb/1004 bb/1003 bb/1002 bb/100
pokalab.com
Theory
Your worst downswing
5 bb/1004 bb/1003 bb/1002 bb/100
5 bb/1004 bb/1003 bb/1002 bb/100
pokalab.com
It slows down. At 5 bb/100, playing 1 million hands instead of 500,000 adds only 18–22k hands to your longest stretch.
Forever? Like the run of tails, it never quite stops growing. But 2 million hands at 5 bb/100 still only give 104–114k hands without a new high.
Winning more helps. Over 1 million hands: 147–158k at 3 bb/100, 81–89k at 5 bb/100.
Is it variance or am I playing badly?
Real regulars’ graphs look exactly like the calculator’s. If yours does too, it is variance.
Chance of being down after a stretch
After
What theory tells usWhat we measured
Chance
10,000 hands1,269 regs
34%
33%
25,000 hands506 regs
31%
30%
50,000 hands176 regs
28%
29%
100,000 hands36 regs
27%
27%
After
What theory tells usWhat we measured
Chance
10,000 hands1,362 regs
27%
27%
25,000 hands685 regs
21%
21%
50,000 hands303 regs
16%
15%
100,000 hands101 regs
11%
15%
pokalab.com
Longest stretch without a new high
Hands played
What theory tells usWhat we measured
Hands
100,000 hands201 regs
42k
43k
200,000 hands40 regs
79k
84k
300,000 hands17 regs
120k
126k
400,000 hands6 regs
181k
240k
Hands played
What theory tells usWhat we measured
Hands
100,000 hands302 regs
30k
29k
200,000 hands100 regs
52k
55k
300,000 hands38 regs
66k
70k
400,000 hands10 regs
95k
72k
pokalab.com
Worst downswing
Hands played
What theory tells usWhat we measured
Buy-ins
100,000 hands201 regs
21
22
200,000 hands40 regs
30
28
300,000 hands17 regs
37
36
400,000 hands6 regs
48
50
Hands played
What theory tells usWhat we measured
Buy-ins
100,000 hands302 regs
20
19
200,000 hands100 regs
27
27
300,000 hands38 regs
29
31
400,000 hands10 regs
33
28
pokalab.com
No extra bad luck: 5% of winning regulars went past the calculator’s 1-in-20 line. Theory predicts 5%.
No bad streaks: a bad 10,000-hand stretch is not followed by another one more often than chance.
Measured
Real graphs: same winrate, different luck
Real graphLongest stretch without a new highThe calculator's range
Lucky reg
NL100 · 3.5 bb/100 · 14 buy-ins down at worst
Typical reg
NL50 · 3.7 bb/100 · 20 buy-ins down at worst
Unlucky reg
NL100 · 2.8 bb/100 · 29 buy-ins down at worst
Lucky reg
NL200 · 2.8 bb/100 · 17 buy-ins down at worst
Typical reg
NL500 · 3.2 bb/100 · 26 buy-ins down at worst
Unlucky reg
NL200 · 2.6 bb/100 · 34 buy-ins down at worst
Lucky reg
NL100 · 2.4 bb/100 · 26 buy-ins down at worst
Typical reg
NL500 · 2.9 bb/100 · 29 buy-ins down at worst
Unlucky reg
NL100 · 2.4 bb/100 · 30 buy-ins down at worst
Lucky reg
NL500 · 1.5 bb/100 · 33 buy-ins down at worst
Typical reg
NL50 · 1.3 bb/100 · 45 buy-ins down at worst
Unlucky reg
NL100 · 1.2 bb/100 · 53 buy-ins down at worst
Lucky reg
NL200 · 3.0 bb/100 · 17 buy-ins down at worst
Typical reg
NL200 · 2.8 bb/100 · 23 buy-ins down at worst
Unlucky reg
NL50 · 2.8 bb/100 · 34 buy-ins down at worst
Lucky reg
NL50 · 3.0 bb/100 · 22 buy-ins down at worst
Typical reg
NL200 · 2.7 bb/100 · 32 buy-ins down at worst
Unlucky reg
NL200 · 3.5 bb/100 · 37 buy-ins down at worst
Lucky reg
NL200 · 3.3 bb/100 · 26 buy-ins down at worst
Typical reg
NL100 · 2.3 bb/100 · 32 buy-ins down at worst
Unlucky reg
NL50 · 3.3 bb/100 · 38 buy-ins down at worst
Lucky reg
NL50 · 2.1 bb/100 · 25 buy-ins down at worst
Typical reg
NL100 · 1.6 bb/100 · 43 buy-ins down at worst
Unlucky reg
NL200 · 1.8 bb/100 · 70 buy-ins down at worst
pokalab.com
Type your own winrate and SD into the calculator below. If your graph stays inside its range, it is variance. If it doesn’t, look at your game with the Leak Finder.
How many hands do you need to know your winrate?
After 10,000 hands, your real winrate can be 16–17 bb/100 away from what you see.
Theory
Your real winrate when you see 3 bb/100
95% of the time.
After
Real winrate
10,000 hands
−13 to +19
100,000 hands
−2 to +8
500,000 hands
+0.7 to +5.3
1 million hands
+1.4 to +4.6
03 bb/100
After
Real winrate
10,000 hands
−14 to +20
100,000 hands
−2 to +8
500,000 hands
+0.6 to +5.4
1 million hands
+1.3 to +4.7
03 bb/100
pokalab.com
To be 95% sure you win at 3 bb/100 you need 202–233k hands.
A player losing 10 bb/100 still shows a profit after 10,000 hands 11–13% of the time.
A month of results says almost nothing; a session says nothing at all.
Cash variance calculator
Type your winrate and SD, see every graph you could get.
Poker variance simulator
bb/100
bb/100
buy-ins
Expected
15,000 bb
150 buy-ins
95% of results
2,804 to 27,196 bb
= 0.6 to 5.4 bb/100
Chance to be down
0.8%
Hands to prove it
233k
Risk of ruin
9.8%
5%: 39 BI · 1%: 60 BI
pokalab.com
It starts at 3 bb/100 and 500,000 hands with an SD of 88, the one of PokerStars’ winning regulars (82 on GGPoker).
What the guides say
The simulators are right; one glossary is far too pessimistic about 20-buy-in downswings.
888poker says a strong winner has “two to three” 20-buy-in downswings per million hands. We measured 6.0 on PokerStars, 4.1 on GGPoker for regulars winning 2–4 bb/100.
888poker also says that past 20 buy-ins “a player is not a legitimate winner”. Yet 31 of the 60 GGPoker regulars and 40 of the 64 PokerStars regulars winning 2–4 bb/100 had one within 100,000 hands.
PrimeDope’s simulator gives the same answers as ours on the same inputs: a 96% chance of a 10-buy-in downswing in 100,000 hands at 5 bb/100, SD 80.
All the cash numbers
Theory
Chance you're still down
After
2 bb/100
3 bb/100
4 bb/100
5 bb/100
10,000 hands
40%
36%
31%
27%
25,000 hands
35%
28%
22%
17%
50,000 hands
29%
21%
14%
9%
100,000 hands
22%
12%
6%
3%
200,000 hands
14%
5%
1%
0.3%
500,000 hands
4%
0.5%
0.0%
0.0%
pokalab.com
Theory
Longest stretch without a new high
The typical player; in brackets, the unluckiest 1 in 20.
If you play
2 bb/100
3 bb/100
4 bb/100
5 bb/100
100,000 hands
43k (95k)
36k (90k)
31k (80k)
26k (67k)
250,000 hands
90k (220k)
69k (175k)
56k (137k)
45k (104k)
500,000 hands
144k (370k)
103k (251k)
78k (178k)
63k (129k)
1 million hands
219k (561k)
147k (330k)
108k (221k)
81k (164k)
2 million hands
312k (711k)
200k (395k)
138k (278k)
104k (197k)
pokalab.com
Theory
Worst downswing, in buy-ins
The typical player; in brackets, the unluckiest 1 in 20.
If you play
2 bb/100
3 bb/100
4 bb/100
5 bb/100
100,000 hands
22 (43)
20 (37)
18 (33)
17 (30)
250,000 hands
32 (59)
27 (49)
24 (42)
22 (37)
500,000 hands
40 (71)
33 (57)
29 (48)
26 (42)
1 million hands
48 (84)
39 (66)
34 (54)
29 (46)
2 million hands
57 (96)
46 (74)
38 (60)
33 (50)
pokalab.com
Regulars with 100,000+ hands, by winrate
The typical regular; in brackets, the unluckiest 1 in 10.
Winrate
Regs
SD
Without a new high: theory
real
Worst downswing: theory
real
Below 0 bb/100
300
80
90k (100k)
87k (100k)
42 BI (67)
41 BI (68)
0 to 2 bb/100
105
79
52k (83k)
57k (84k)
24 BI (34)
25 BI (33)
2 to 4 bb/100
60
82
37k (62k)
38k (63k)
20 BI (29)
21 BI (29)
4 to 7 bb/100
33
80
26k (45k)
28k (50k)
17 BI (25)
16 BI (29)
pokalab.com
Measured
How long it takes to climb out of a downswing
Hands until half of them were back at a new high; a dash: fewer than 30 downswings.
Winrate
10 buy-ins down
Downswings
20 buy-ins down
Downswings
0 to 2 bb/100
32,900 hands
823
86,500 hands
260
2 to 4 bb/100
23,900 hands
498
65,000 hands
86
4 to 7 bb/100
16,600 hands
273
—
19
7 and up bb/100
12,000 hands
69
—
3
pokalab.com
Theory
Chance you're still down
After
2 bb/100
3 bb/100
4 bb/100
5 bb/100
10,000 hands
41%
37%
32%
28%
25,000 hands
36%
29%
24%
18%
50,000 hands
31%
22%
15%
10%
100,000 hands
24%
14%
8%
4%
200,000 hands
15%
6%
2%
0.6%
500,000 hands
5%
0.8%
0.1%
0.0%
pokalab.com
Theory
Longest stretch without a new high
The typical player; in brackets, the unluckiest 1 in 20.
If you play
2 bb/100
3 bb/100
4 bb/100
5 bb/100
100,000 hands
44k (96k)
37k (92k)
32k (83k)
28k (70k)
250,000 hands
93k (224k)
73k (190k)
59k (141k)
48k (113k)
500,000 hands
152k (391k)
109k (270k)
85k (195k)
67k (141k)
1 million hands
236k (594k)
158k (357k)
116k (241k)
89k (180k)
2 million hands
338k (801k)
217k (451k)
151k (308k)
114k (218k)
pokalab.com
Theory
Worst downswing, in buy-ins
The typical player; in brackets, the unluckiest 1 in 20.
If you play
2 bb/100
3 bb/100
4 bb/100
5 bb/100
100,000 hands
24 (47)
22 (41)
20 (37)
18 (33)
250,000 hands
35 (65)
30 (54)
27 (47)
24 (42)
500,000 hands
44 (78)
37 (64)
32 (54)
28 (48)
1 million hands
53 (94)
44 (73)
38 (61)
33 (52)
2 million hands
64 (107)
51 (83)
43 (68)
37 (57)
pokalab.com
Regulars with 100,000+ hands, by winrate
The typical regular; in brackets, the unluckiest 1 in 10.
Winrate
Regs
SD
Without a new high: theory
real
Worst downswing: theory
real
Below 0 bb/100
50
90
78k (99k)
70k (98k)
38 BI (55)
37 BI (55)
0 to 2 bb/100
68
87
52k (82k)
53k (81k)
26 BI (38)
26 BI (37)
2 to 4 bb/100
64
87
37k (62k)
36k (62k)
21 BI (32)
21 BI (31)
4 to 7 bb/100
97
91
27k (45k)
25k (44k)
19 BI (27)
19 BI (27)
7 and up bb/100
73
89
17k (30k)
17k (30k)
15 BI (22)
14 BI (19)
pokalab.com
Measured
How long it takes to climb out of a downswing
Hands until half of them were back at a new high; a dash: fewer than 30 downswings.
Winrate
10 buy-ins down
Downswings
20 buy-ins down
Downswings
0 to 2 bb/100
30,800 hands
536
84,900 hands
177
2 to 4 bb/100
20,600 hands
671
52,700 hands
163
4 to 7 bb/100
17,200 hands
736
38,000 hands
115
7 and up bb/100
12,900 hands
494
31,900 hands
37
pokalab.com
The players — regulars (the REG family, player types), 6-max cash, four to six dealt, no ante; each room on its own.
A graph — one regular at one stake, the hands in order, after rake and before rakeback, read every 100 hands like the calculator. A buy-in is 100 bb.
Theory next to real graphs — the calculator run with each regular’s own winrate and SD, ending where the regular ended: a regular’s winrate is only known from that same graph.
Still down — every stretch of that many hands in a winning regular’s graph, on graphs at least twice as long.
The three real graphs — winning regulars with that many hands at one stake, within 1 bb/100 of each other and as close to 3 bb/100 as three of them stand: the ones at the 10th, 50th and 90th percentile of worst downswing, over their first that many hands. The range behind each one is the calculator’s at that regular’s own winrate and SD.
What it does not cover — regulars who quit after a bad run, players who move down a stake, ante and short-handed games.
Measured on 2026-11-03: 302 winning regulars with 100,000+ hands on PokerStars, 201 on GGPoker.
Theory only: tournament winnings are not in hand histories. In cash games, where we can check, real graphs match the calculator.
How many tournaments can you play without winning?
Pick any day. 1 time in 20, you are still down after:
370
tournaments at 50% ROI
2,100
tournaments at 20% ROI
8,100
tournaments at 10% ROI
Theory
Chance you're still down
1,000-player fields, 15% paid, 10% rake.
50% ROI20% ROI10% ROI
pokalab.com
After 1,000 tournaments you are still down 13% of the time at 20% ROI, 30% at 10% ROI.
Bigger fields, longer waits. At 20% ROI you are still down after 1,000 tournaments 6% of the time in 100-player fields, 26% in 10,000-player fields.
Without a cash: 32 tournaments in a row is normal over 5,000.
You lose most of your buy-ins and win a few big ones, so your graph goes down step by step and jumps up now and then. The bigger the field, the rarer and bigger the jumps.
How far down can you go in MTTs?
Pick any day. 1 time in 20, you fall this far below it:
55
buy-ins at 50% ROI
186
buy-ins at 20% ROI
402
buy-ins at 10% ROI
That is your bankroll: with fewer buy-ins, you go broke more than 1 time in 20.
What about a whole MTT career?
Same as in cash games: each new day is one more chance to hit a bad stretch, so your worst one keeps growing, slower and slower.
Theory
Your longest stretch without a new high
1,000-player fields, 15% paid, 10% rake.
50% ROI20% ROI10% ROI
pokalab.com
Theory
Your worst downswing
1,000-player fields, 15% paid, 10% rake.
50% ROI20% ROI10% ROI
pokalab.com
MTT variance calculator
MTT variance simulator
%
%
buy-ins
pokalab.com
All the MTT numbers
Theory
MTT downswings by ROI and field size, over 1,000 tournaments
The typical player; in brackets, the unluckiest 1 in 20.
ROI · players
Worst downswing
Without a new high
Without a cash
Still down
10% · 100
94 BI (185)
447 (959)
27 (39)
21%
10% · 1,000
128 BI (246)
543 (993)
27 (39)
30%
10% · 10,000
159 BI (295)
651 (1,000)
27 (39)
43%
20% · 100
75 BI (140)
326 (793)
25 (37)
6%
20% · 1,000
100 BI (193)
435 (929)
25 (37)
13%
20% · 10,000
121 BI (235)
535 (992)
25 (37)
26%
50% · 100
44 BI (75)
153 (346)
20 (29)
0%
50% · 1,000
55 BI (98)
222 (493)
20 (29)
0%
50% · 10,000
63 BI (114)
275 (641)
20 (29)
1%
pokalab.com
Theory only: Sit & Go winnings are not in hand histories. In cash games, where we can check, real graphs match the calculator.
How many Sit & Gos can you play without winning?
Pick any day. At 5% ROI, 1 time in 20, you are still down after:
890
heads-up or DoN games
2,300
6-max games
2,400
9-max games
Theory
Chance you're still down
5% ROI, 7% rake.
HU, DoN6-max9-max
pokalab.com
Heads-up and Double or Nothing pay every winner the same prize, so they swing about half as much as 9-max.
How far down can you go in Sit & Gos?
Pick any day. At 5% ROI, 1 time in 20, you fall this far below it:
26
buy-ins in heads-up or DoN
61
buy-ins in 6-max
65
buy-ins in 9-max
That is your bankroll: with fewer buy-ins, you go broke more than 1 time in 20.
What about 5,000 Sit & Gos?
Theory
Your longest stretch without a new high, over 5,000 games
5% ROI.
Game
Games
Heads-up
700
6-max
1098
9-max
1123
DoN
700
pokalab.com
Theory
Your worst downswing, over 5,000 games
5% ROI.
Game
Buy-ins
Heads-up
32
6-max
61
9-max
64
DoN
32
pokalab.com
Sit & Go variance calculator
SNG variance simulator
%
9-max
%
buy-ins
pokalab.com
Theory only: Spin & Go winnings are not in hand histories. The prize tables are the rooms’ own, read on GGPoker and PokerStars in November 2026.
How many Spins can you play without winning?
Pick any day. At 5% ROI on $5 Spins, 1 time in 20, you are still down after:
3,500
Spins on PokerStars
3,200
Spins on GGPoker
Theory
Chance you're still down
5% ROI, $5 Spins.
PokerStarsGGPoker
pokalab.com
You break even if you win 35.9% of your games on GGPoker, 36.3% on PokerStars. A 5% ROI means winning 37.8% / 38.1%.
The jackpot is part of your ROI. The x200,000 (GGPoker) and x240,000 (PokerStars) come up once in 10 million games, but they are worth 0.7 and 0.9 points of a 5% ROI. Without them you really play a 4.3% / 4.1% game.
How far down can you go in Spins?
Pick any day. At 5% ROI, 1 time in 20, you fall this far below it:
79
buy-ins on PokerStars
78
buy-ins on GGPoker
That is your bankroll: with fewer buy-ins, you go broke more than 1 time in 20.
What about 50,000 Spins?
Your longest stretch without a new high is about 3,800–4,100 games, and your worst downswing 120–124 buy-ins.
How often does each prize pool come up?
92.5% of GGPoker games and 87.4% of PokerStars games are played for 2 or 3 buy-ins, winner takes all.
Spin & Go prize pools, $5 games
Prize pool
GGPoker Spin & Gold
PokerStars Spin & Go
Jackpot
x200,000 · 1 in 10,000,000
x240,000 · 1 in 10,000,000
x100
1 in 25,000
1 in 20,000
x50
1 in 12,500
1 in 10,000
x25
—
1 in 1,333
x10
2.4%
1.0%
x5
2.5%
2.5%
x4
2.6%
9.0%
x3
44.6%
37.4%
x2
47.9%
50.0%
pokalab.com
Spin & Go variance calculator
Spin & Go variance simulator
%
PokerStars
$5
buy-ins
pokalab.com
All the Spin & Go numbers
Theory
Spin & Go at 5% ROI, every buy-in, 50,000 games
The typical player.
Room · buy-in
Break-even
Jackpot
Worst downswing
Without a new high
PokerStars · $0.5
36.3% wins
x12,000 · 1 in 10,000,000
109 BI
3,209 games
PokerStars · $1
36.3% wins
x12,000 · 1 in 10,000,000
109 BI
3,209 games
PokerStars · $2
36.3% wins
x12,000 · 1 in 10,000,000
109 BI
3,209 games
PokerStars · $5
36.3% wins
x240,000 · 1 in 10,000,000
124 BI
4,118 games
PokerStars · $10
35.9% wins
x12,000 · 1 in 10,000,000
109 BI
3,217 games
PokerStars · $25
35.5% wins
x12,000 · 1 in 10,000,000
111 BI
3,213 games
PokerStars · $50
35.5% wins
x12,000 · 1 in 10,000,000
111 BI
3,213 games
PokerStars · $100
35.1% wins
x12,000 · 1 in 10,000,000
113 BI
3,311 games
PokerStars · $250
35.1% wins
x4,800 · 1 in 10,000,000
112 BI
3,308 games
PokerStars · $500
35.1% wins
x2,400 · 1 in 10,000,000
112 BI
3,309 games
PokerStars · $1000
35.1% wins
x1,200 · 1 in 10,000,000
112 BI
3,296 games
GGPoker · $0.25
35.9% wins
x40,000 · 1 in 2,000,000
120 BI
3,754 games
GGPoker · $1
35.9% wins
x100,000 · 1 in 5,000,000
120 BI
3,760 games
GGPoker · $3
35.9% wins
x100,000 · 1 in 5,000,000
120 BI
3,760 games
GGPoker · $5
35.9% wins
x200,000 · 1 in 10,000,000
120 BI
3,760 games
GGPoker · $10
35.9% wins
x100,000 · 1 in 5,000,000
120 BI
3,760 games
GGPoker · $20
35.9% wins
x50,000 · 1 in 2,500,000
120 BI
3,751 games
GGPoker · $50
35.9% wins
x20,000 · 1 in 1,000,000
120 BI
3,750 games
GGPoker · $100
35.9% wins
x10,000 · 1 in 666,667
118 BI
3,628 games
GGPoker · $200
35.9% wins
x5,000 · 1 in 333,333
118 BI
3,630 games
pokalab.com
Theory, with the swings of real PLO regulars measured on PokerStars. GGPoker has too few PLO hands to measure.
How many PLO hands can you play without winning?
Pick any day. At 3 bb/100, 1 time in 20, you are still down after:
581k
hands in PLO
202–233k
hands in hold'em
Theory
Chance you're still down
3 bb/100 in both games.
PLOHold'em
PLOHold'em
pokalab.com
How far down can you go in PLO?
Pick any day. At 3 bb/100, 1 time in 20, you fall this far below it, even if you play forever:
97
buy-ins in PLO
34–39
buy-ins in hold'em
That is your bankroll: with fewer buy-ins, your risk of going broke is above 5%.
How much more does PLO swing?
About twice as much: the same winrate gives downswings twice as deep as hold’em’s.
Theory
Your worst downswing over 500,000 hands
3 bb/100 in both games.
Game
Buy-ins
PLO
71
Hold'em on PokerStars
37
Hold'em on GGPoker
33
pokalab.com
Measured
How much regulars' results swing
Standard deviation over 100 hands.
Game
bb/100
PLO NL25
139
PLO NL50
139
PLO NL100
134
PLO NL200
131
PLO NL500
131
Hold'em on PokerStars
88
Hold'em on GGPoker
82
pokalab.com
With four cards, more hands stay close in equity until the end, so more pots get big, and every downswing and bankroll number grows with them.
PLO variance calculator
PLO variance simulator
bb/100
bb/100
buy-ins
Expected
15,000 bb
150 buy-ins
95% of results
−4,264 to 34,264 bb
= −0.9 to 6.9 bb/100
Chance to be down
6.3%
Hands to prove it
581k
Risk of ruin
39.4%
5%: 97 BI · 1%: 149 BI
pokalab.com
Questions
What is variance in poker?
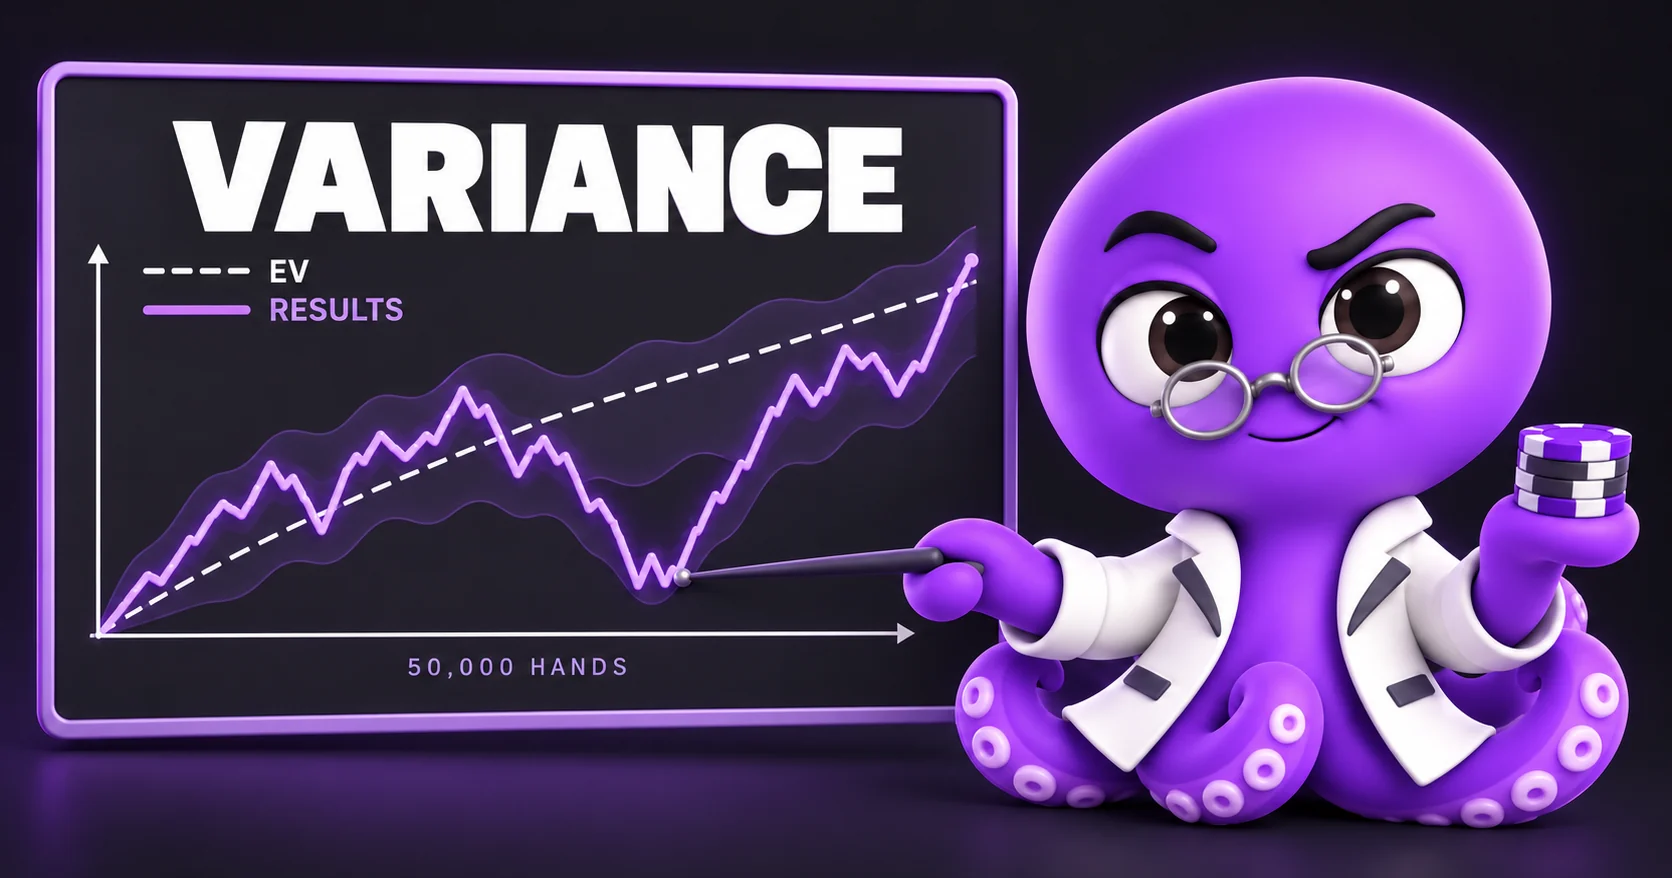
It is the gap between your results and what your play is really worth. A cash game regular's results move by 82–88 big blinds every 100 hands, while a good winrate is 2 to 5 bb/100 — so luck draws most of your graph.
How many hands can you play without winning?
More than you think. Pick any day: at 5 bb/100 you are still down 10,000 hands later 27–28% of the time, 50,000 hands later 9–10% of the time. 1 time in 20 you are still down after 73–84k hands at 5 bb/100, and after 202–233k at 3 bb/100.
How long can a poker downswing last?
At 3 bb/100, the longest stretch without a new high of your career is about 36–37k hands if you play 100,000 hands, 103–109k if you play 500,000 and 147–158k if you play a million. It keeps growing because every day is a new chance to hit a bad stretch, but slower and slower.
How many buy-ins is a normal downswing?
At 3 bb/100, your worst downswing is about 20–22 buy-ins over 100,000 hands and 33–37 over 500,000. One player in 20 loses 57–64 buy-ins over 500,000 hands.
Is a 20 buy-in downswing normal?
Yes. At 3 bb/100 it is the typical worst downswing over 100,000 hands, and real regulars confirm it: those winning 2 to 4 bb/100 lost 21 buy-ins at worst on GGPoker and 21 on PokerStars over their first 100,000 hands.
How many hands do I need to know my winrate?
After 10,000 hands your real winrate can still be 16–17 bb/100 away from what you see. To be 95% sure you beat the game at 3 bb/100, you need 202–233k hands.
Is my downswing bad luck, or am I playing badly?
Type your winrate and standard deviation into the variance calculator. If your graph stays inside its range, it is bad luck: real regulars' downswings are exactly as long and as deep as the calculator says. If you are far below it, look at your game.
How long do MTT downswings last?
At 20% ROI in 1,000-player fields, 1 time in 20 you are still down 2,100 tournaments later. Over 5,000 tournaments, your longest stretch without a new high is about 1,120 tournaments and your worst downswing about 177 buy-ins. That is theory: tournament winnings are not in hand histories.
How swingy is Spin & Go?
At 5% ROI on $5 Spins, 1 time in 20 you are still down 3,200–3,500 games later. You break even if you win about 35.9% of your games on GGPoker and 36.3% on PokerStars.
Is PLO more swingy than hold'em?
Yes. PLO regulars swing 139 bb per 100 hands, against 82–88 in hold'em. At the same 3 bb/100, the worst downswing over 500,000 hands is 71 buy-ins in PLO and 33–37 in hold'em.
 pokalab.com